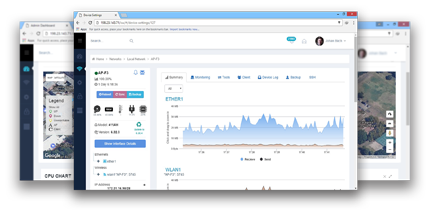
Network Mapping and Dashboards page
Automate network mapping; visualize and pinpoint network outages and performance degradation
The IT network is forever dynamic; the static network maps often fail to capture the new changes in the network. When a network fault occurs, it becomes impossible to track the affected device or business service using the static network diagrams. With Nitrowave automatic network mapping, administrators can

The Dashboards tab contains dashboards with a visual display of real-time information, consolidated , arranged and network mapping tools in a single view, so that it can be easily monitored. The Dashboard displays various statistical data related to number of Requests, Changes, Problems, Assets, and Contracts based on various criteria

The Dashboards page contains the following elements by default
- Helpdesk
- Problem & Change
- Network Mapping
- Filters
- Settings
HeatMaps
HeatMaps gives you an ‘at-a-glance’ picture of the state of all monitored devices in real-time from a single page. It uses color codes to communicate the severity of devices in your IT infrastructure. Clicking on a particular device displays the full information about it.


